A signature curve tracer is a simple yet useful device in any electronics lab. It shows in picture form the V/A characteristic of a two-terminal device under test (DUT), such as a resistor, a capacitor, a diode or any PN junction. It could also be used to characterise a transistor or an optocoupler, if additional drive circuit for the third terminal is used. Another use is in locating circuit faults: as the probe terminal of the Curve Tracer is brought to every pin of an IC mounted on the probed but unpowered PCB, a faulty IC pin will typically exhibit much different VA characteristic than the other pins (because some structures on that pin a burned out inside the IC).
The Curve Tracer in principle works by applying a small AC voltage from a source with a large internal impedance (e.g. 10k) across the two terminals of a device under test (DUT). The DUT will pass some current in response to the voltage applied. The Curve Tracer measures the immediate voltage on the DUT, and the immediate current through the DUT. The V/A is shown on a CRT, wherein the measured voltage is used for a horizontal deflection of the beam, and the measured current for the vertical deflection.
When there is no DUT connected to the instrument’s terminals (= an infinite resistance), a flat horizontal line is drawn on the CRT. The current through the open terminals is 0mA, therefore there is no vertical deflection. Voltage at the terminals is sweeping between -10V to +10V in a 1kHz sine wave, therefore generating a full horizontal line on the CRT.
When the instrument’s terminals are shorted together (= 0ohm), a vertical line is drawn on the CRT. Voltage across the terminals is 0V (since they are shorted), but the current is changing from -1mA to +1mA (in the low range; or -10mA to +10mA in the high range). Now the horizontal deflection is zero, but the vertical is a full line.
Resistors of different values as the DUT cause a sloping line; the angle depends on the resistance. Capacitors draw a circle, since the current is phase shifted relative to the voltage by capacitance. Diode or any PN junction draws the typical picture known from datasheets; with a Zener diode it is possible to observe forward and reverse conduction in one picture.

Capacitor 33n 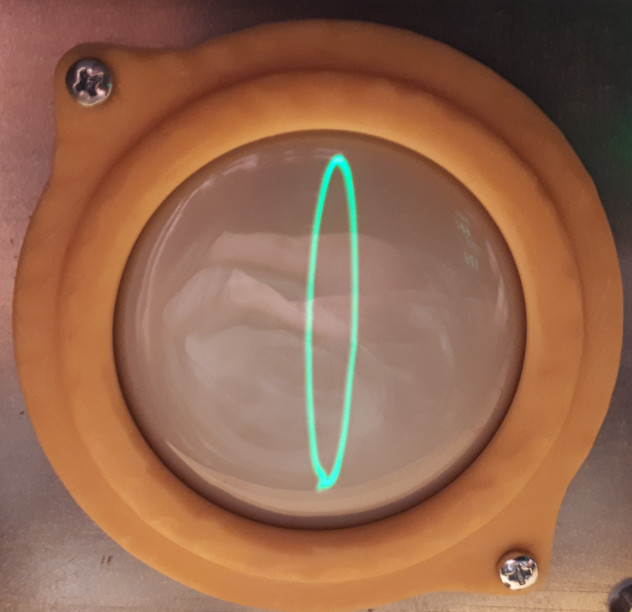
Capacitor 100n 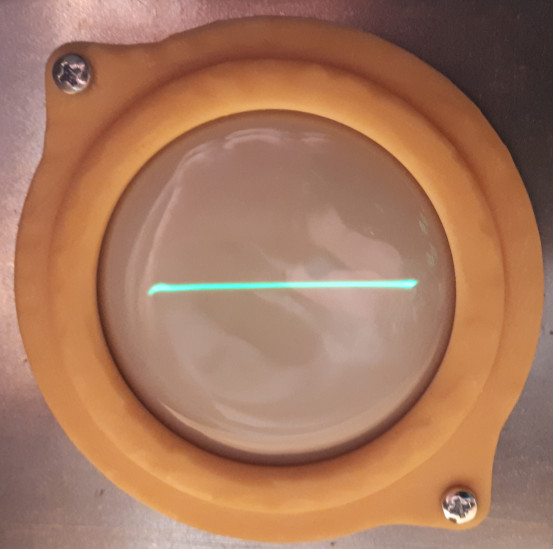
Open terminals 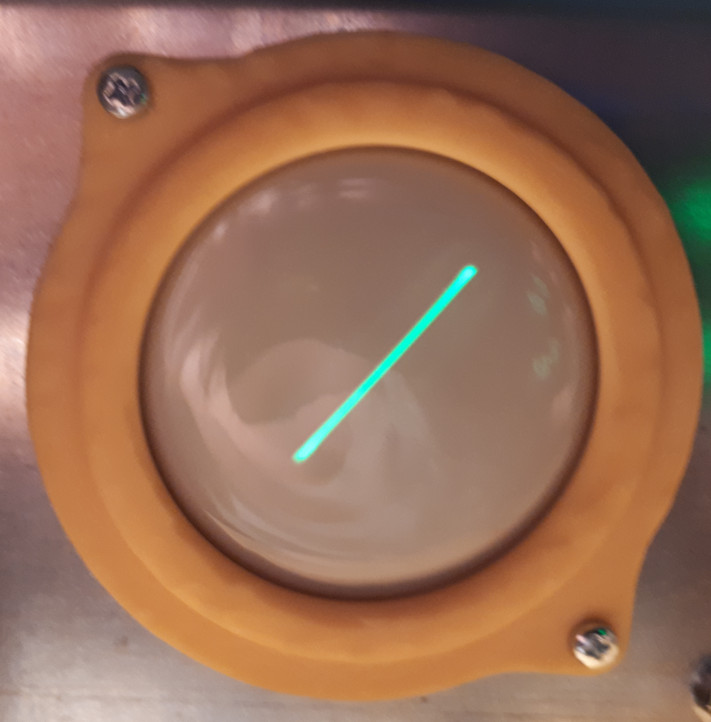
Resistor 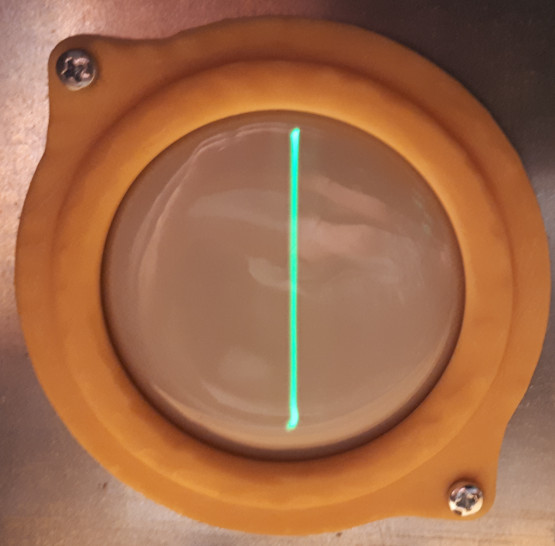
Shorted terminals 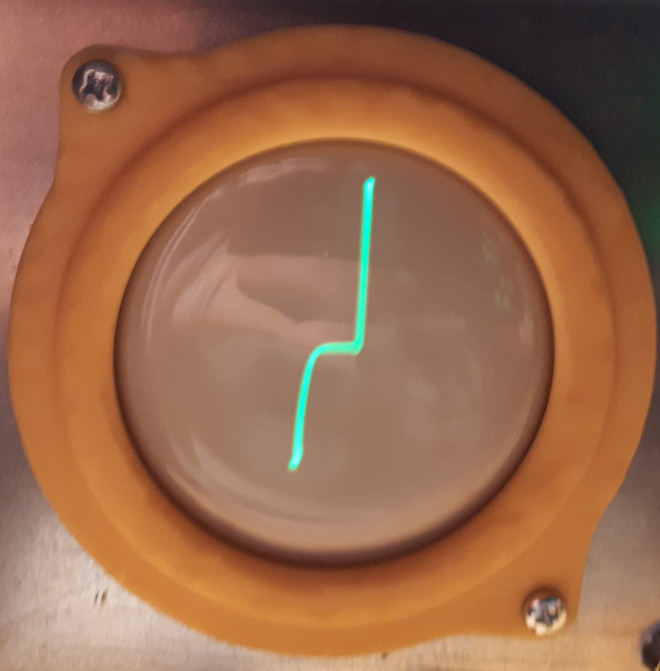
Zener 3V9 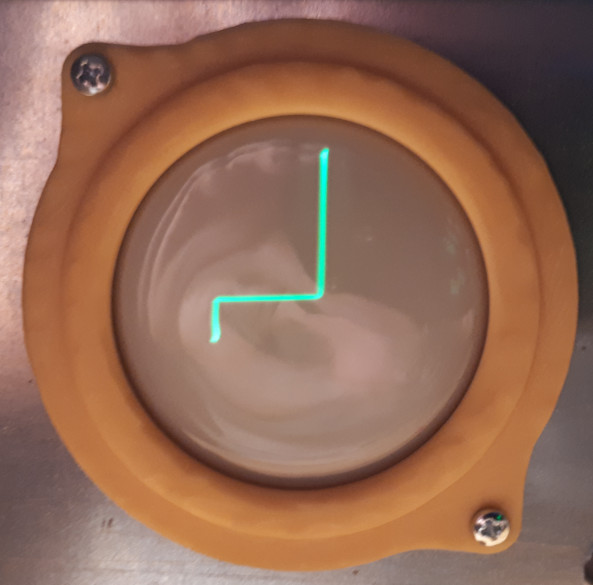
Zener 6V8
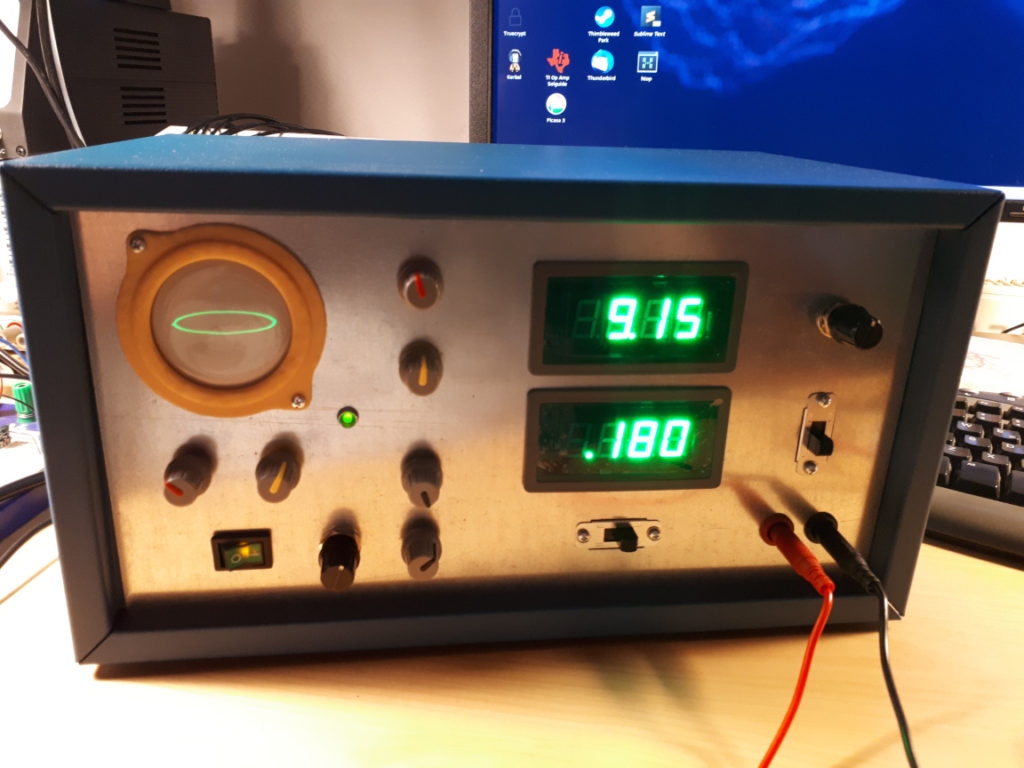
The Curve Tracer is extended by two peak-value meters, implemented by two 3 1/2 digital meters on the front panel. The meters show the peak voltage and the peak current through the DUT during a sine-wave period. A switch on the panel allows the selection between the positive peaks (maxima – V/A Quadrant I.) or the negative peaks (minima – V/A Quadrant III.). By slowly rising the amplitude of the drive signal on the DUT by a potentiometer on the front panel of the instrument, the user may obtain the precise voltage and current reading of any point of the V/A characteric shown on the CRT, even as the CRT picture itself is not calibrated.
Specifications of the Curve Tracer:
- drive signal cca 1kHz bipolar sine wave with max amplitude +/-13V, continuosly adjustable by a 10-turn potentiometer.
- two ranges of the drive current: low-range 0.1mA/V (i.e. +/-1.3mA at the max drive amplitude 13V), and high-raneg 1mA/V (i.e. +/-13mA at the max drive amplitude 13V).
- small CRT 5LO38I (Soviet-era), diameter 5cm, with all beam controls for position, zoom, brightness and focus on the front panel.
- peak meters for the voltage and current measurements in the I. and III. quadrant.
- automatic stand-by function that blanks the CRT and extends its life when there is no DUT connected.
- fully manual and analog-only operation.
- 100% hacker-proof By-Design since there is No Software Inside ™.
Theory of Operation
See the schematic diagram in pdf.
Sheet “Curve Tracer”
Opamp U201A, type TL074, is connected as a Wien oscillator. It is producing a sine wave of cca 1kHz (exact frequency is not important), with an amplitude of about 2V. During bring-up use the trimmer RV201 to adjust the amplitude to the maximal value but without clipping. Lamp LA201, type ZG1, is a small 12V/50mA bulb. The lamp is mounted on the PCB inside the box, since it does not have the usual indication function. It stabilizes the oscillator by the positive temperature coeficient of its filament: higher amplitude causes higher current, which in turn increases the resistance of the filament, which eventually leads to lower amplitude.
TBD: oscillogram of the wien output.
Variable resistor RV202 is a 10-turn potentiometer mounted on the front panel. It allows the user to regulate output amplitude between 0V and cca 13V. Opamp U201B provides the necessary amplification and drive of the output signal from the curve tracer. The output banana terminals mounted on the front panel are labeled J201 in the schematic.
DPDT switch SW201A, mounted on the front panel, allows choice of two operation ranges: a low-drive range with R205=10k, when the switch is in position “1” as drawn in the schematic, and the high-drive range in position “2” with R206=1k. In the low-drive range a 1V sine wave at the output terminals will prodouce 0.1mA through them when they are shorted (due to the R206=10k resistor being in series). In the high-drive range a 1V produces 1mA through the 1k resistor.
Opamp U201C is a differential amplifier with a high input impedance 220k due to R208 and R209. It senses current through the output terminals by measuring voltage accross the “shunt” resistors R205 or R206. Switch SW201B and variable trimmers RV203 and RV204 are used to “level” the output horizontal trace with nothing connected at the output terminals; this is necessary to do separately for each range.
Opamp U201D is a buffer amplifier for the horizontal axis – the “volts” in the VA characteristic. Variable resistors RV205 and RV206 are potentiometers on the front panel. They change picture zoom in the horizontal and vertical axies.
Sheet “Peak Meters”
The Curve Tracer measures positive and negative peak voltages of the V/A characteristic of the connected device under test (DUT), as well as the positive and negative peaks of its current. The input signal VSIG provides the immediate “voltage” in the VA characteristic, and the signal ASIG the current “mAmps”. Since the DUT is driven with 1kHz sine wave, four independent peak detectors must measure and hold the maxima and minima of voltage and current for the short moments between sine wave periods.
Stable peak voltages are displayed on two digital LED front-panel voltmeters, type WPB5135-DV 19,99V. The voltmeters have range 0V to 20V, although sadly they do not provide the +/- sign indication. In this application it does not matter much, since we always know the sign according if we switch SW301 to the positive or negative peaks.
Switch SW301 allows choice for measuring either the positive maxima peak of voltage/current in position “1” (Qudrant I.), or the negative minima peak in position “2” (Quadrant III).
Since the CRT display is not calibrated, it is not possible to directly read the V/A points on the screen, just to observe qualitatively its shape. The user should be slowly adjusting the AMPLITUDE (RV201) of the drive signal applied to the output terminals, and read the V/A position of the top-right (or bottom-left) curve end-points on the peak meters. By switching SW301 it is possible to read exact V/A of both end-points in the first and the third quadrants.
Sheet “Stand-by Detector”
When nothing is connected to the Curve tracer terminals a stable horizontal line is displayed on the CRT. If left in this state for extended time periods, the horizontal line could be burnt into the CRT phosphor. The stand-by detector monitors the ASIG signal, which is the vertical deflection signal corresponding to the mAmps of the VA characteristic. When ASIG is close to 0V for long time, the stand-by detector pushes trace off the CRT screen, thus saving some of the CRT life.
Opamp U401A is a pre-amplifier. Trimmer RV401 should be adjusted so that when the ASIG is close to 0V (nothing is connected to the instrument terminals), the output of U401A should be minimal. When there is a signal, the output should pass it. Opamps U401B and U401C form a signal rectifier, and the opamp U401D is a peak detector.
A stand-by monostable timer is created by 1/2 of NE556 in U402A. When there is no signal on ASIG, the peak detector output is low (0V), transistor Q401 is closed (not conducting), and the monostable timer U402A is running. When it runs out in about 1 minute, it switches to the stable output state = low, where it remains indefinetely (until it is reset, see below). This brings a high voltage cca 8V to the output signal BLANK, taking the picture away from the CRT. At the same time the second half of the NE556, U402B, runs a simple LED blinker: D406 blinks at about 1Hz, indicating that the Curve Tracer is in the stand-by mode.
When there is a signal on ASIG (e.g. a test component is newly connected to the output terminals), even for a short moment (e.g. the user quickly shorts the leads), the peak detector output goes high to cca 13V. This opens Q401 and the timer U402A is immediately reset to the high output state. Q402 is closed, therefore picture blanking is disabled. The Q403 will be open, therefore U402B is held in reset with its output high – the LED D406 is full ON. This state persists so long as there is a non-zero signal on ASIG, or the monostable timer runs out in 1 minute.
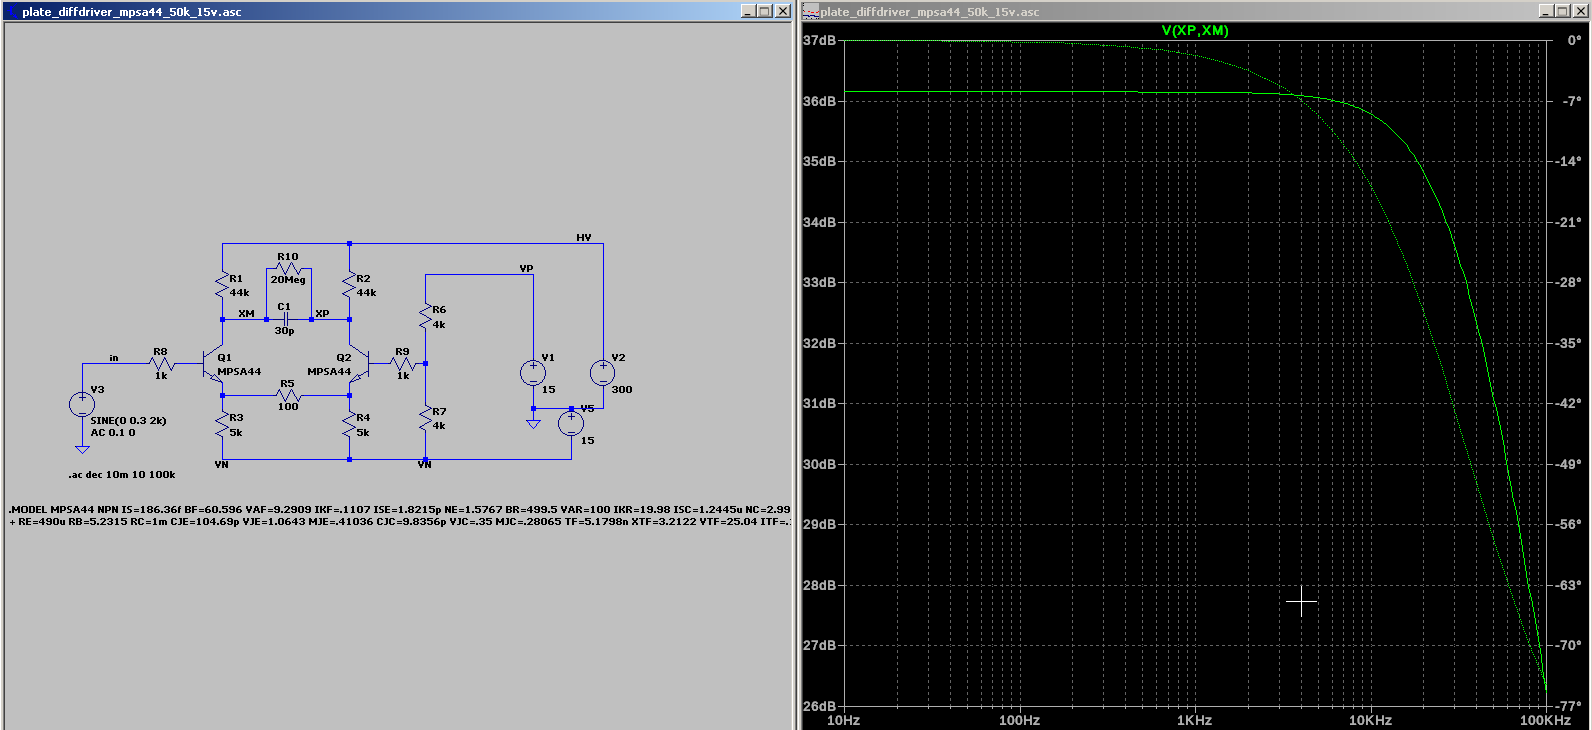
Sheet “Plate Amplifiers”
There are two identical high-voltage amplifiers with differential outputs for trace deflection. The horizontal “X” deflection is driven by the XSIG, which is derived from the voltage accross the output terminals. The vertical “Y” deflection is driven by YSIG, which is derived from the current through the output terminal to ground. Thus we obtain a picture of the V/A characteristic on the CRT.
The amplifiers used in this design have bandwidth of more than 100kHz (shown below), which is more than enough to provide a picture with sharp corners.
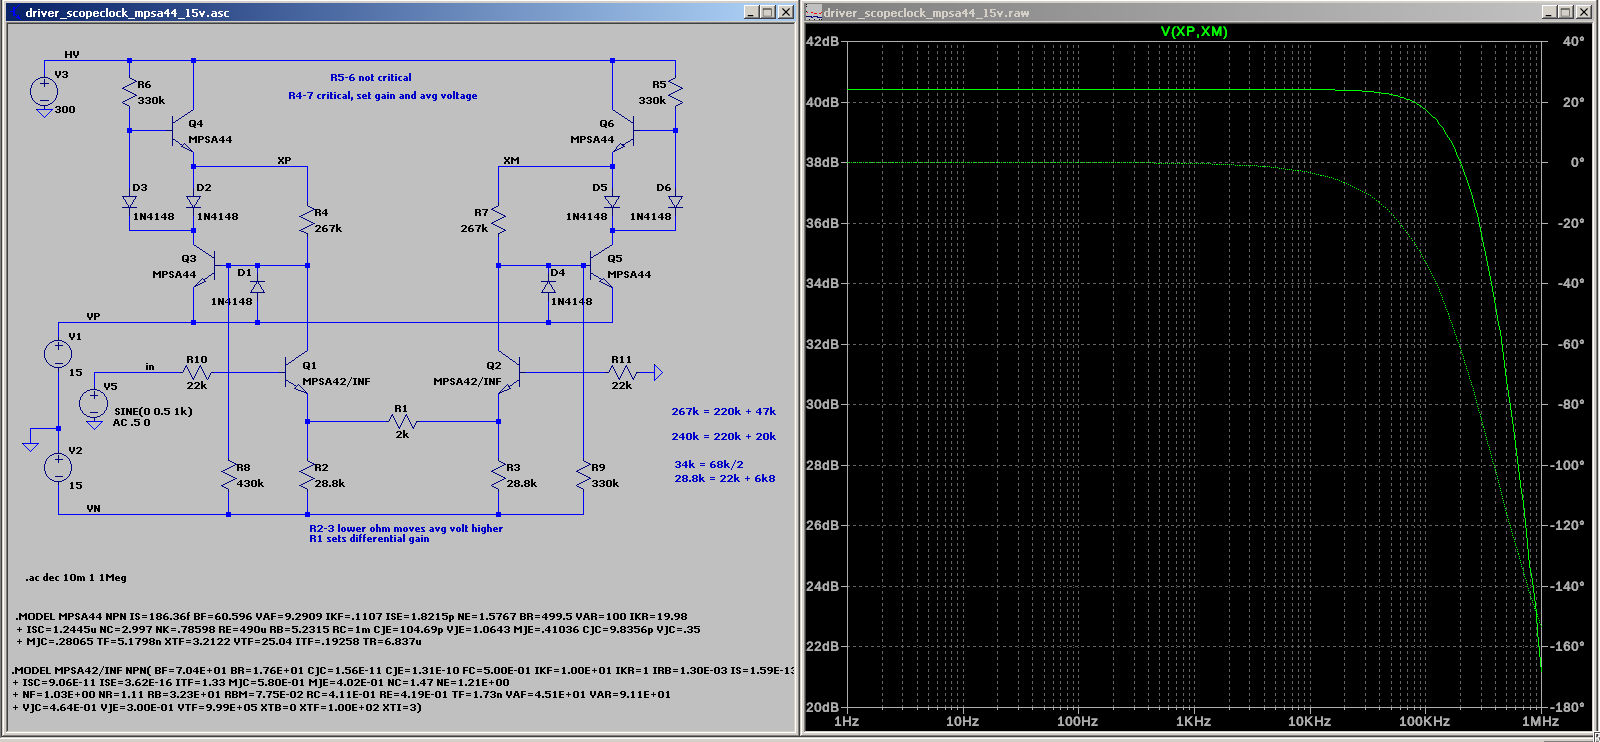
For comparison, a simple amplifier with only two transistors and small collector resistors has typical bandwith only about 10kHz (shown below), which is not enough to “bend” the trace quick enough in sharp corners of a VA characteristic of a diode, for example.
Picture position on screen is adjustable by the two front-panel mounted potentiometers RV501 (for Y-positon) and RV502 (for X-position). Picture blanking in the stand-by mode is done by transistor Q513 by shunting the base of Q510 to negative voltage, thus bringing picture far away from the screen in the X position.
TBD: add simulation files
Sheet “CRT and the High-voltage supply”
The CRT type 5LO38I has about +300V on the anode, and about -400V on the gate. This small CRT thankfully does not need the post-deflection anode (PDA), which in other CRTs necessitates one additional kV-range supply with flyback (in large colour CRTs this is the 20kV source). Nevertheless, the voltages present inside the Curve Tracer are very dangerous and quite lethal on touch!
Cathode should be a bit more positive by several tens of volts than the gate, to achieve the desired picture brightness; this is adjustable by the panel-mounted potentiometer RV601. Picture focus is adjustable by the panel-mounted potentiometer RV602. The anode should be the most positive voltage. However, picture is difficult to focus in all areas of the screen if the anode voltage too above the average plate voltage. Therefore it is dropped down by the panel-mounted potentiometer RV603.
High-voltages are generated in transformer T601. A small toroid transformer, bought some time ago on eBay, and originally intended for vacuum tube audio amplifiers is used here. The transformer has 240V AC / 30mA high-voltage secondary windig, and one 6.3V winding for a heater. A single-phase rectifier with D603 generates a high voltage about +330V, which has a relatively large ripple of several volts. Thus it is stabilized by U601, type LR8, to +300V for use by the plate amplifiers. Negative voltage of about -400V is generated by a voltage multiplier with D601 and D602.
All electrolytic capacitors in this sheet store very dangerous high-voltage charge. Any touching could be lethal! Even the 6.3V heater winding is sitting at -300V potential relative to ground! Since electrical charge is stored in capacitors long after the mains supply is turned off, parallel bleed resistors 22k are added to all the capacitors. They ensure that dangerous voltages are discharges within 1 minute (!) after power off. Further, a neon tube NE601 on the PCB is alight when there is a voltage >60V across the most-dangerous capacitor C602, 220uF/400V. Never touch any part of the circuit -even after power-off- when this neon tube is on!
Sheet “Low-voltage power supply”
The symetrical +/- 15V rails for opamps are generated by a linear power supply with a transformer T701, and regulators 7815 and 7915. The regulators should be mounted on heat sinks.
Additional transformer T702 generates twice 9V AC for the two digital panel-mounted voltmeters MPS301 and MPS302, type WPB5135-DV 19,99V. These 3 1/2 digit 7-segment LED voltmeters are based on the famous ICL7106 (or its clone) and require separate floating supplies relative to their measuring input.
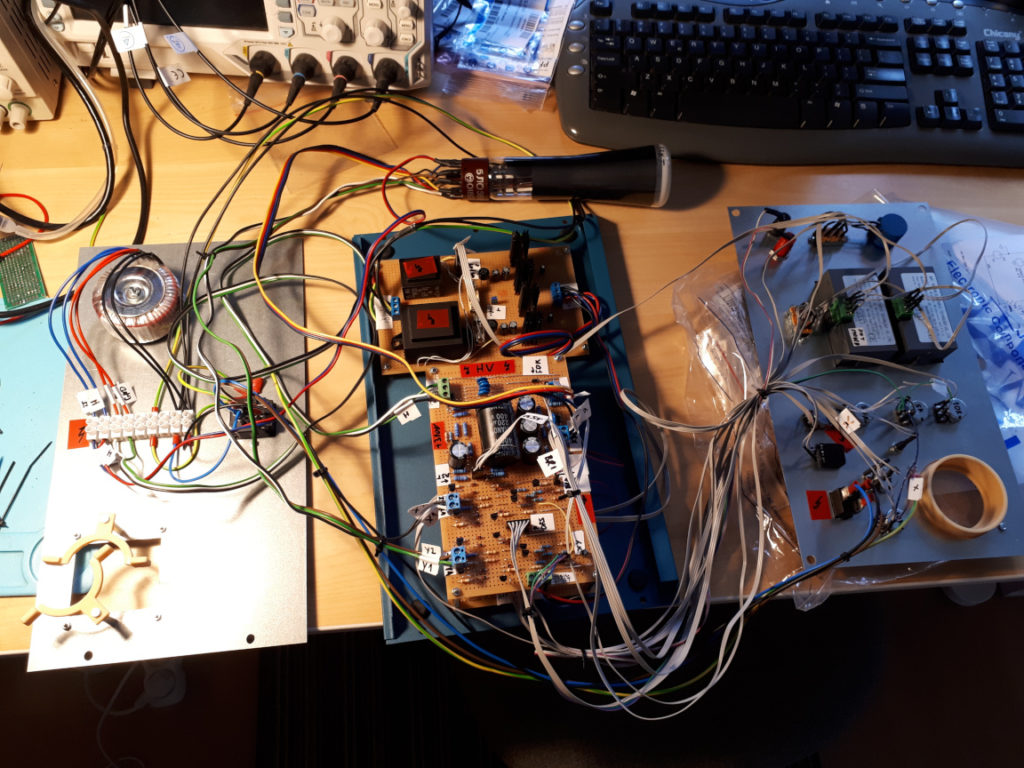
PCB
The electronic circuits are built on universal PCBs 10x16cm, RE318-HP.
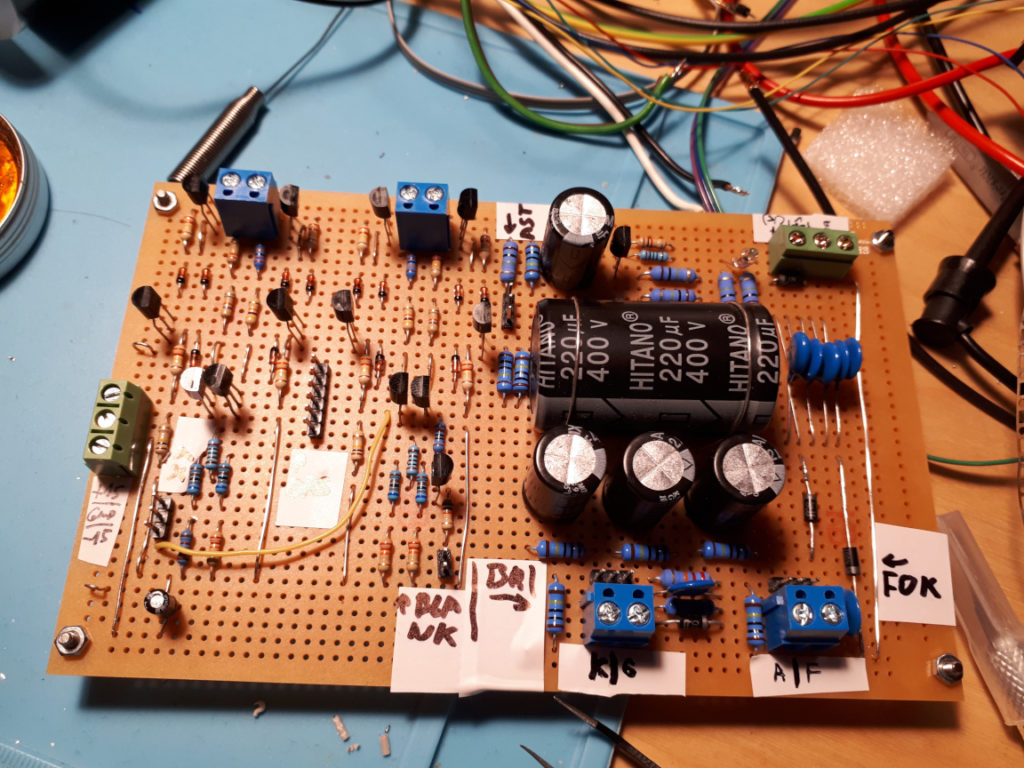
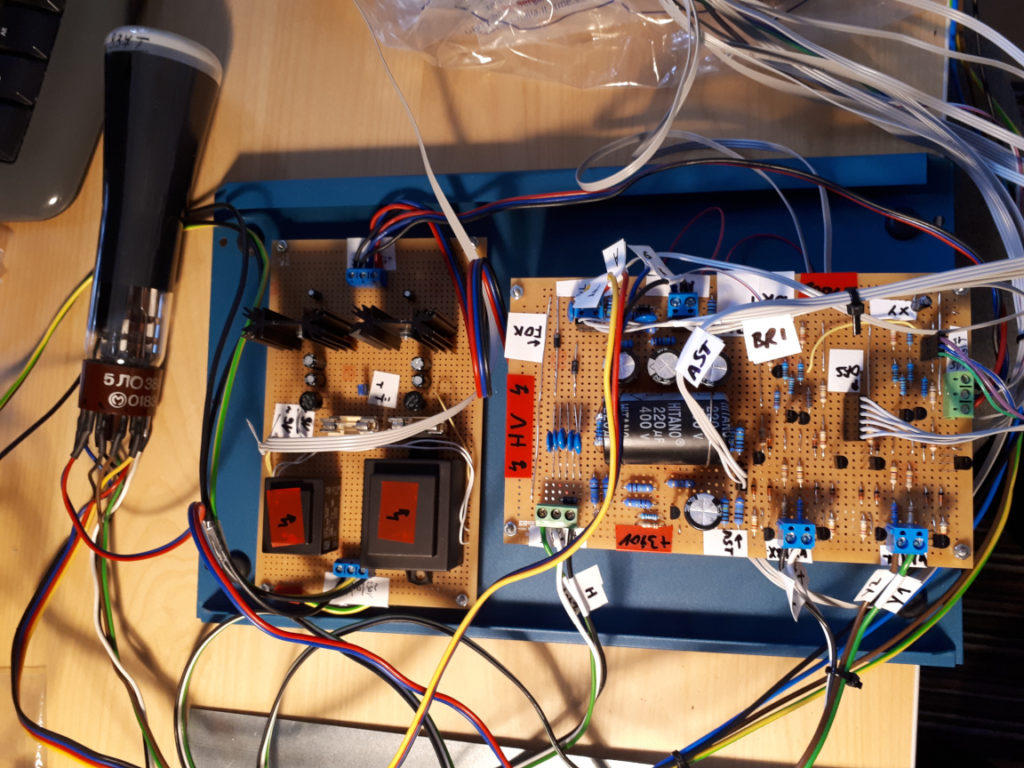
Plate amplifiers (left), HW supply (right) 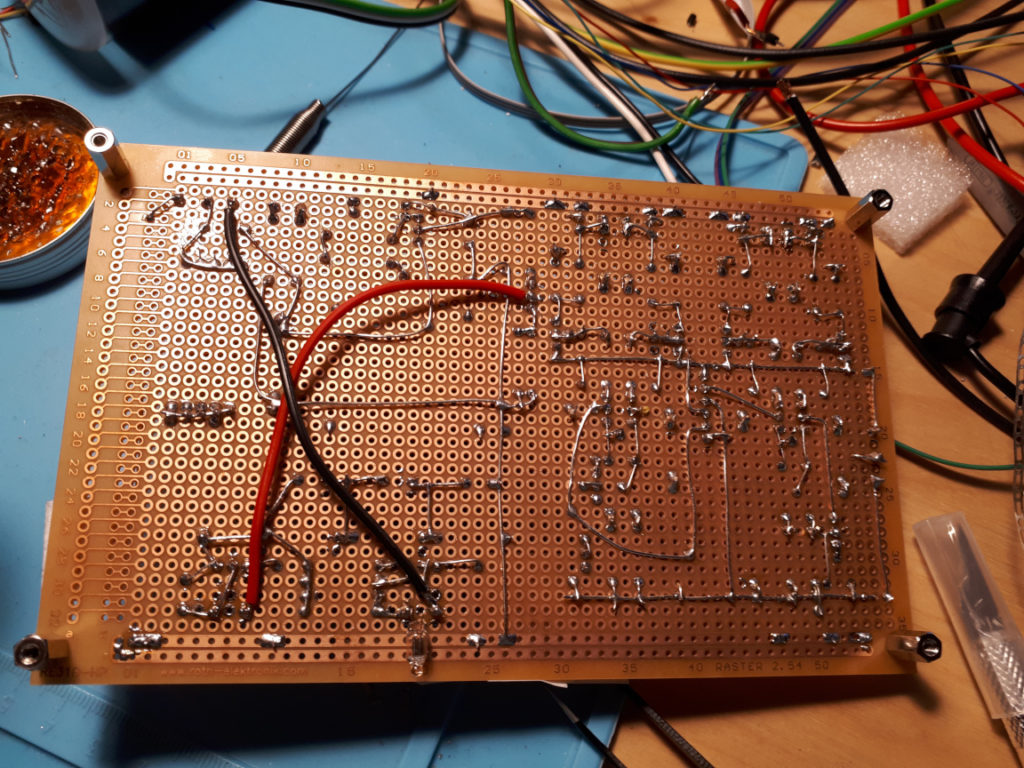
Bottom of HV supply/Plate ampl. 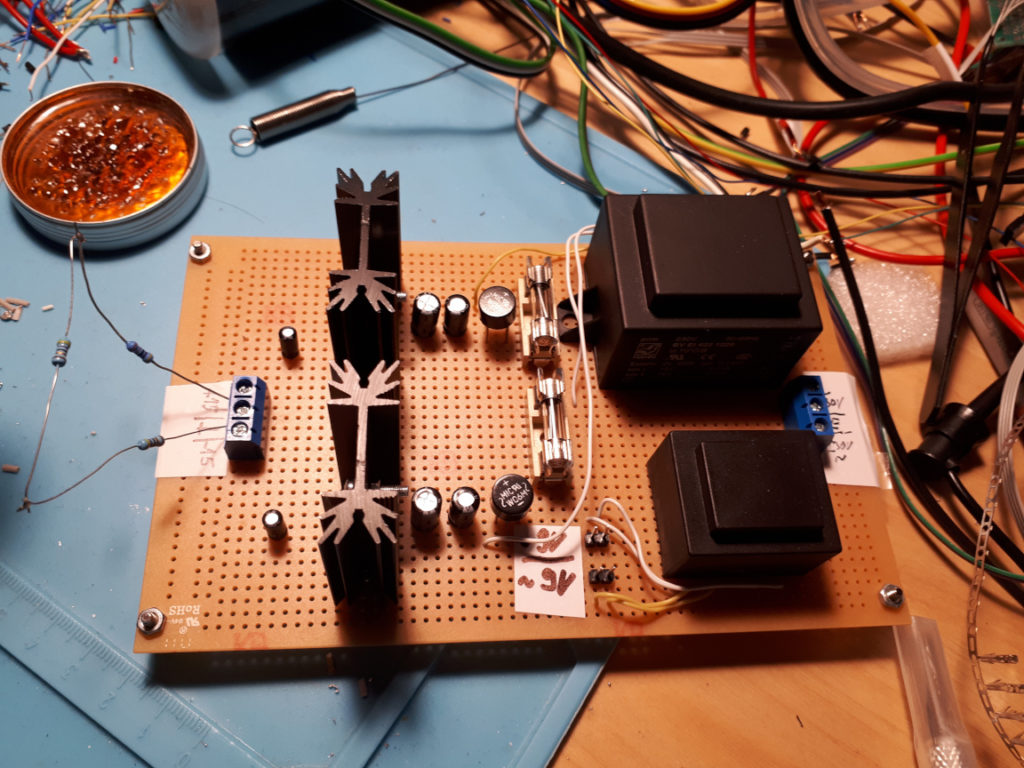
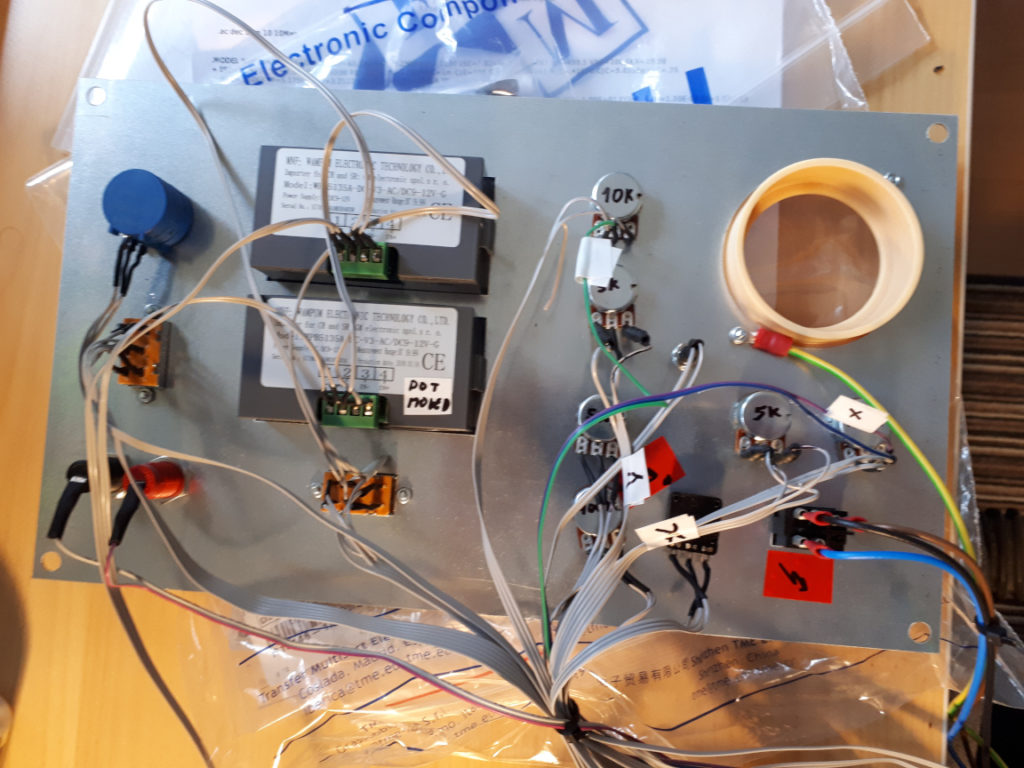
Low-voltage supply 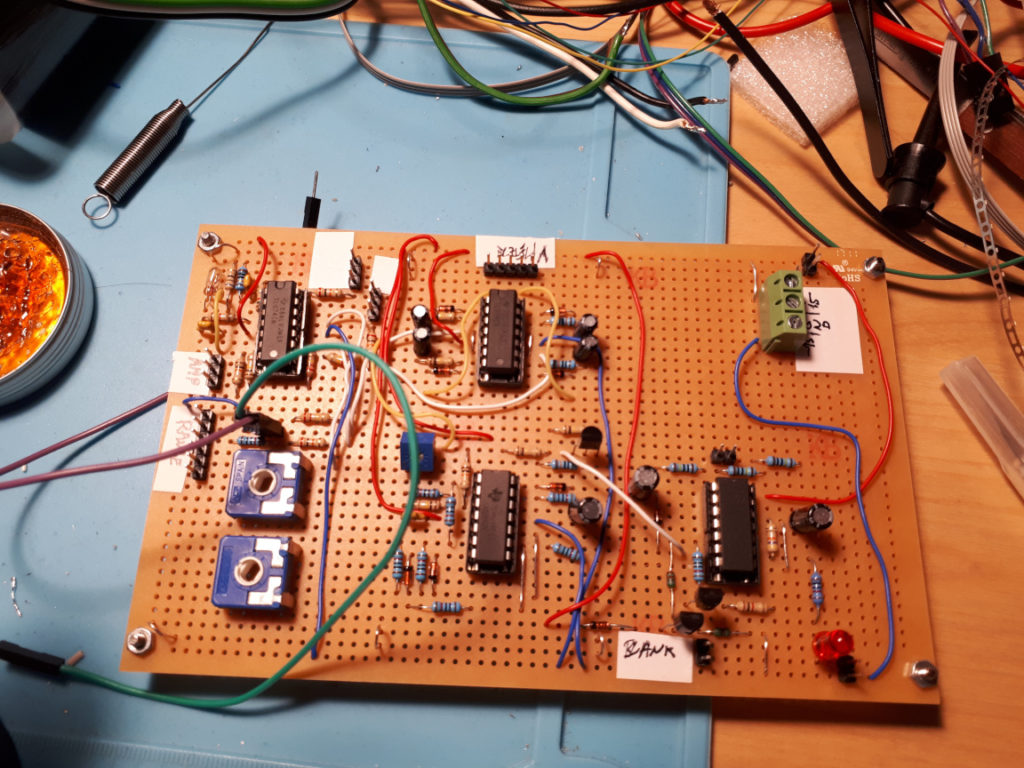
Curve tracer and stadby-circuuit 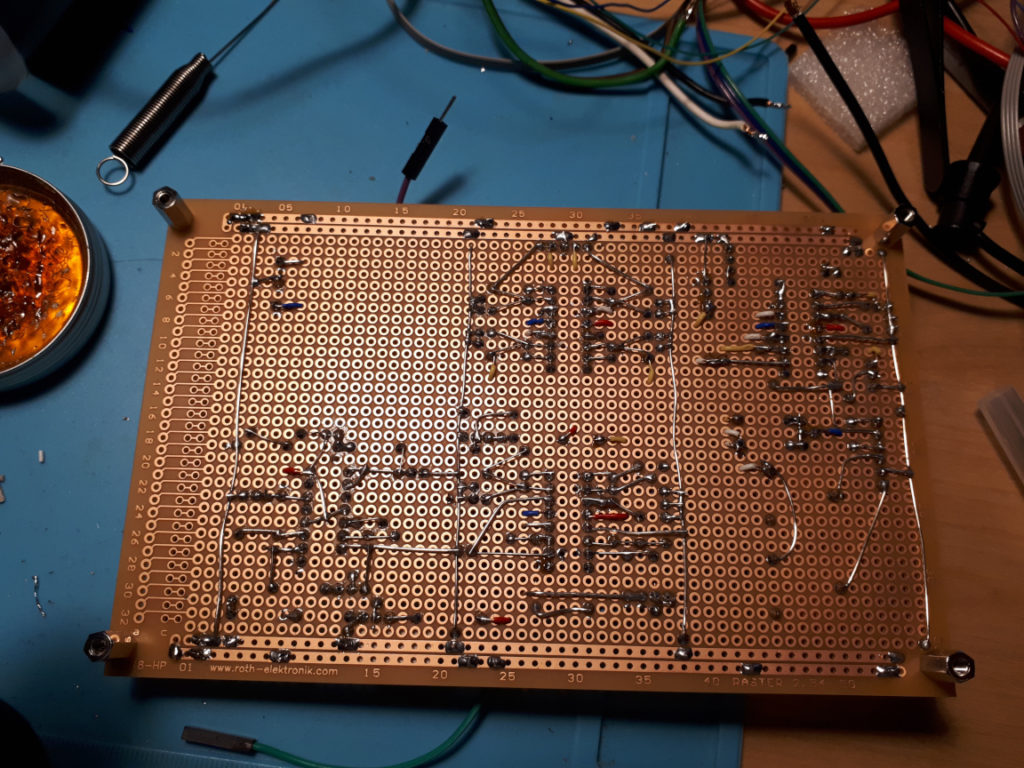
Bottom of curve tracer
Mechanical Construction
Mechanical construction is based on BUD Industries’ metal enclosure type MD-1960, available from Mouser. This box provides plenty of panel space for mounting all the many and necessary potentiometers, switches and voltmeters, and the CRT. Since there is no additional shielding of the CRT inside the box, the metal enclosure itself provides the shielding againts stray magnetic fields that could distort the picture on CRT. A plastic box would necessitate an additional CRT shield inside.
Autodesk Fusion 360 was used to 3D-model the box and all the electromechanical components on the front panel as well inside the box and on the rear panel. This allowed perfect fitting together of all the components during the design. Finalised 3D model was used to generate: a) front-panel and rear-panel drawings in 2D DXF files, b) 3D STEP models of the CRT front-pannel collar and of the CRT neck holders, to be printed from a plastic material on a 3D SLA printer.
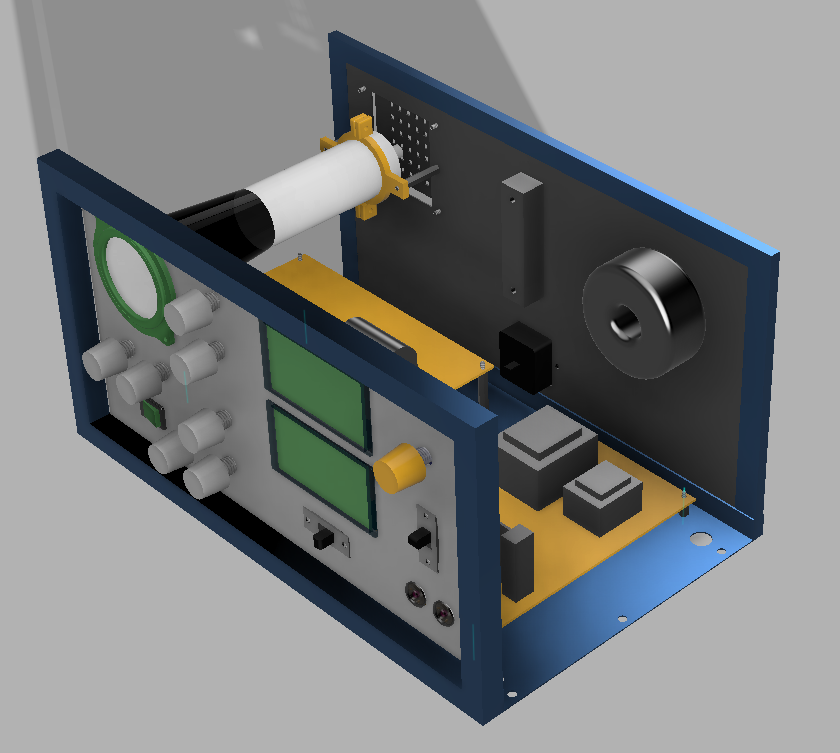
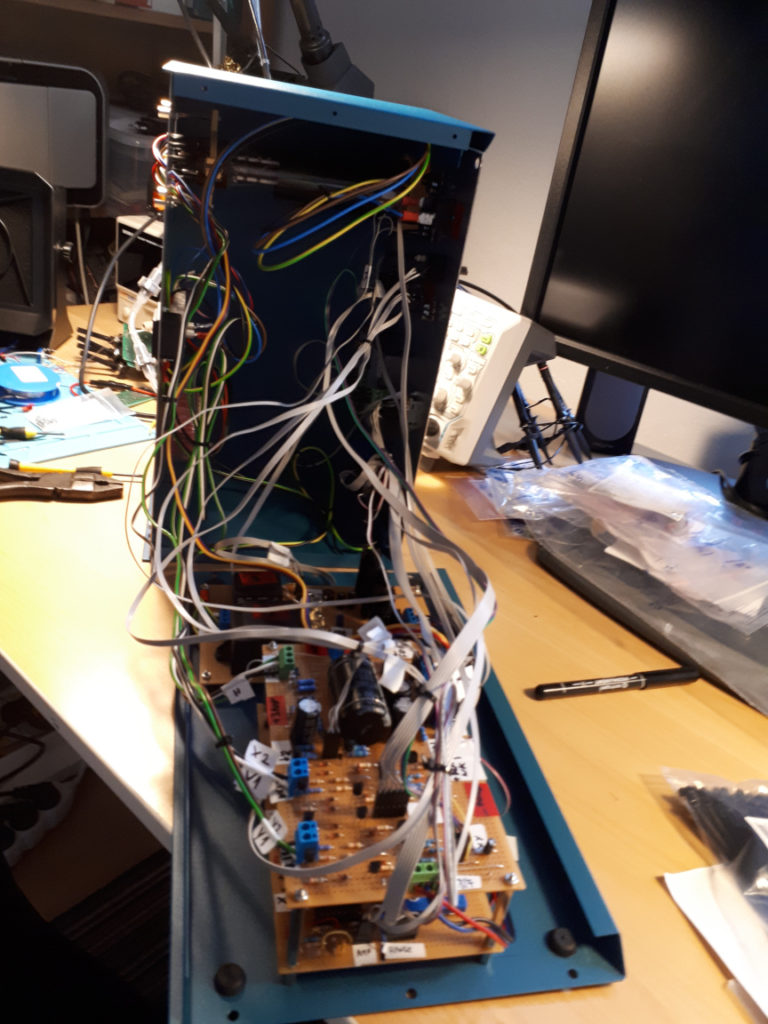
Overall view 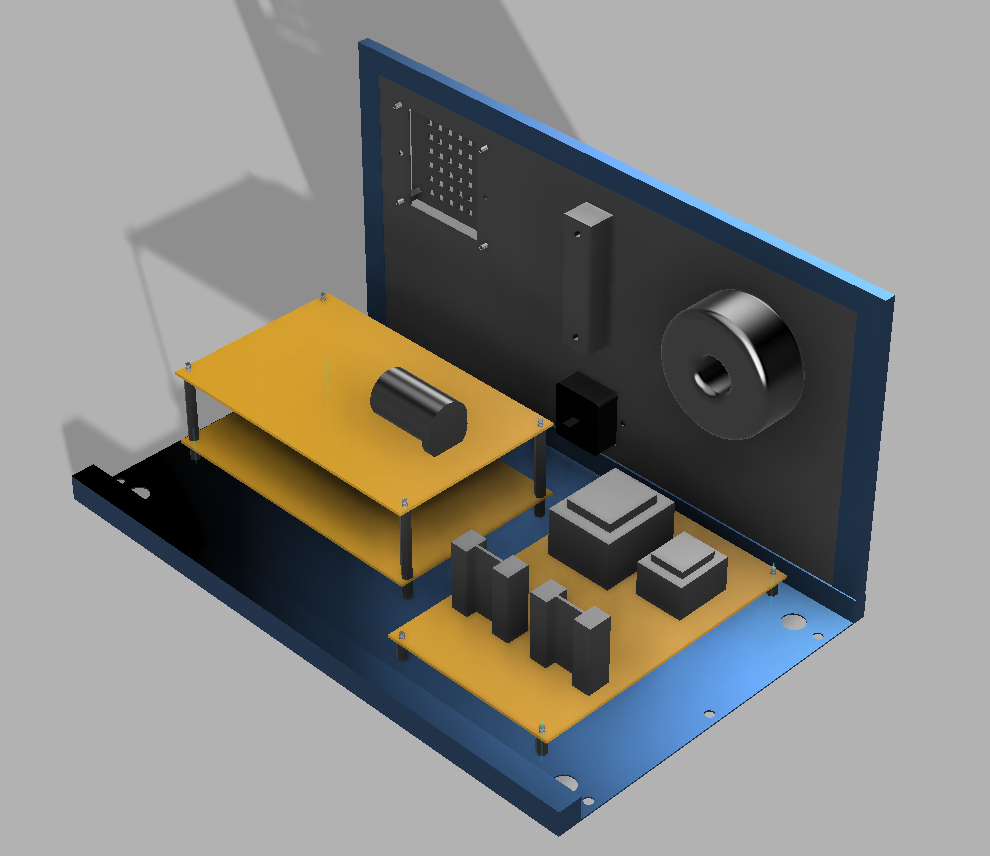
Inside and rear panel 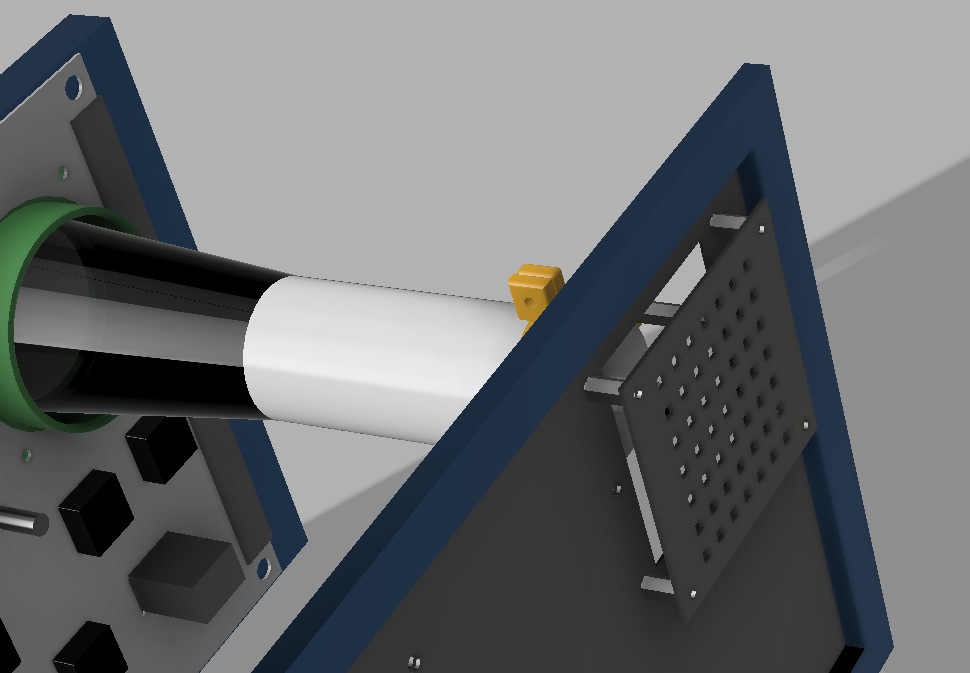
Neck cover on the rear panel 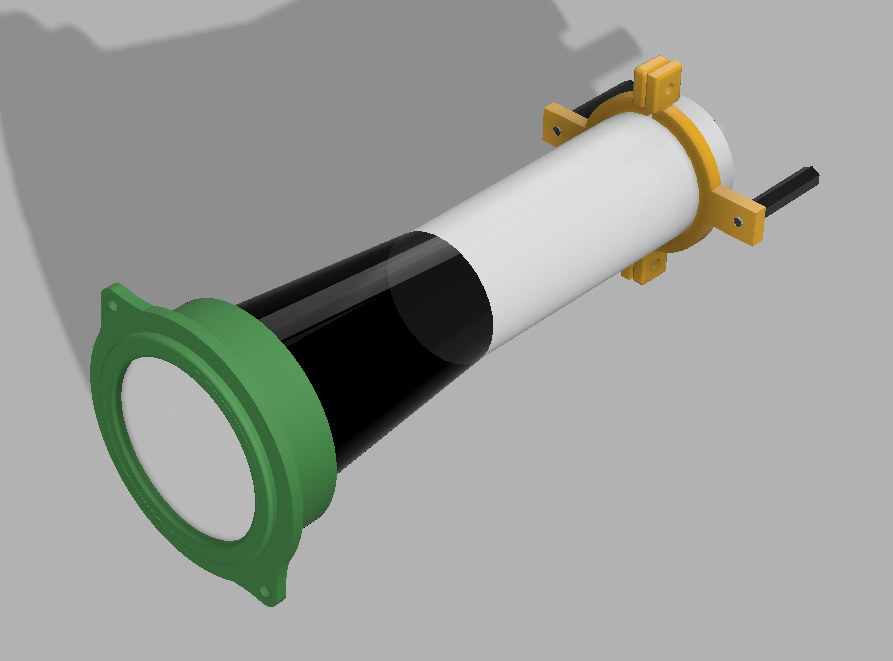
Picture tube assembly 
Front view
The front and rear metal panels that came with MD-1960 were not used in the construction. Instead new panels of the exact same size, but with all the necessary holes for the mounted components, were newly cut by laser from 1mm steel by an external company (idilna.cz). The e-shop interface of this company allows input from a DXF file, which could be generated in Fusion 360 by exporting a planar sketch, once the 3D model was finished. Laser cutting is cheap but it allows only flat panels to be cut. Any bending would have to be done manually, which is inprecise in hobby conditions. This is the reason why MD-1960 enclosure was chosen: even as it is not cheap, its front and rear panels are completely flat removable metal pieces, therefore they could be easily replaced by laser-cut parts made to the project’s need.
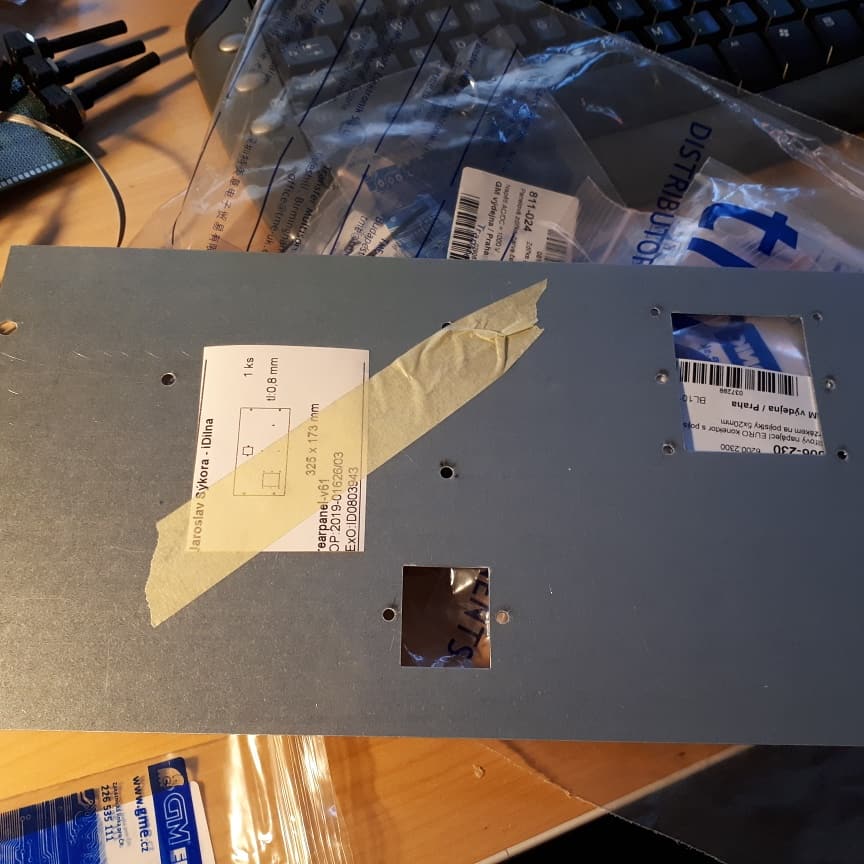
Laser cut rear panel 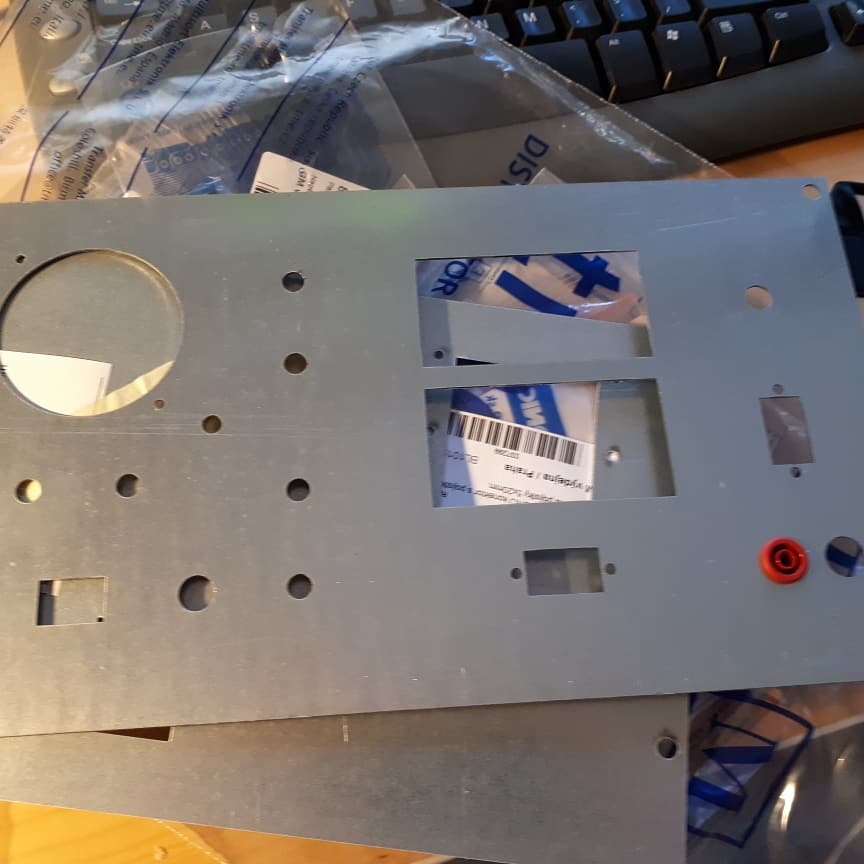
Laser cut front panel 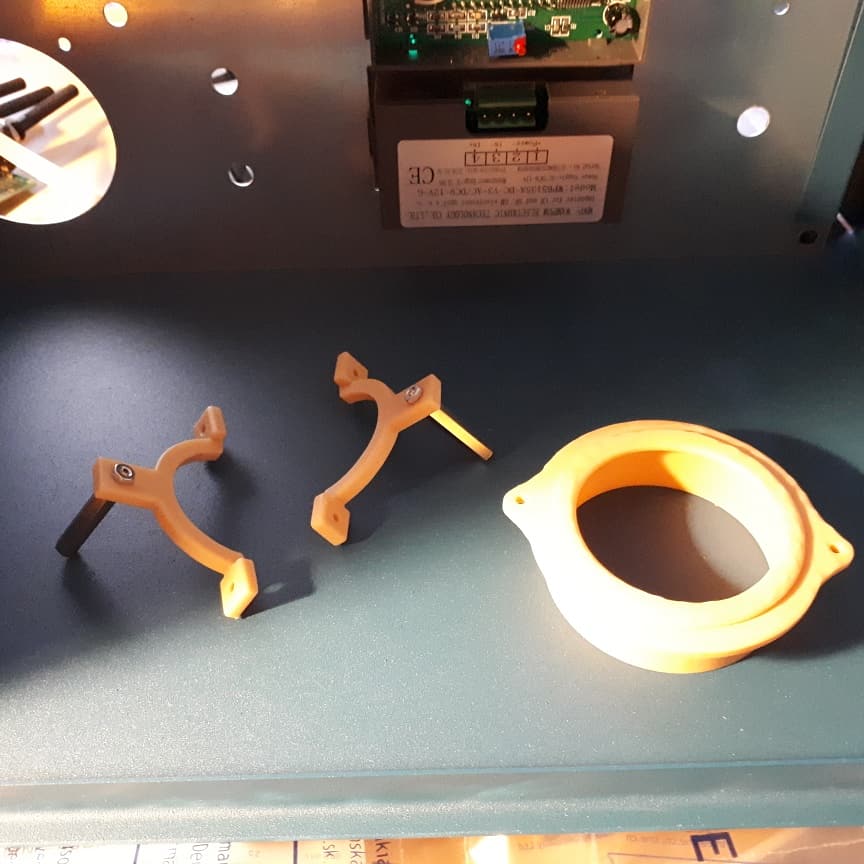
3D-printed pieces 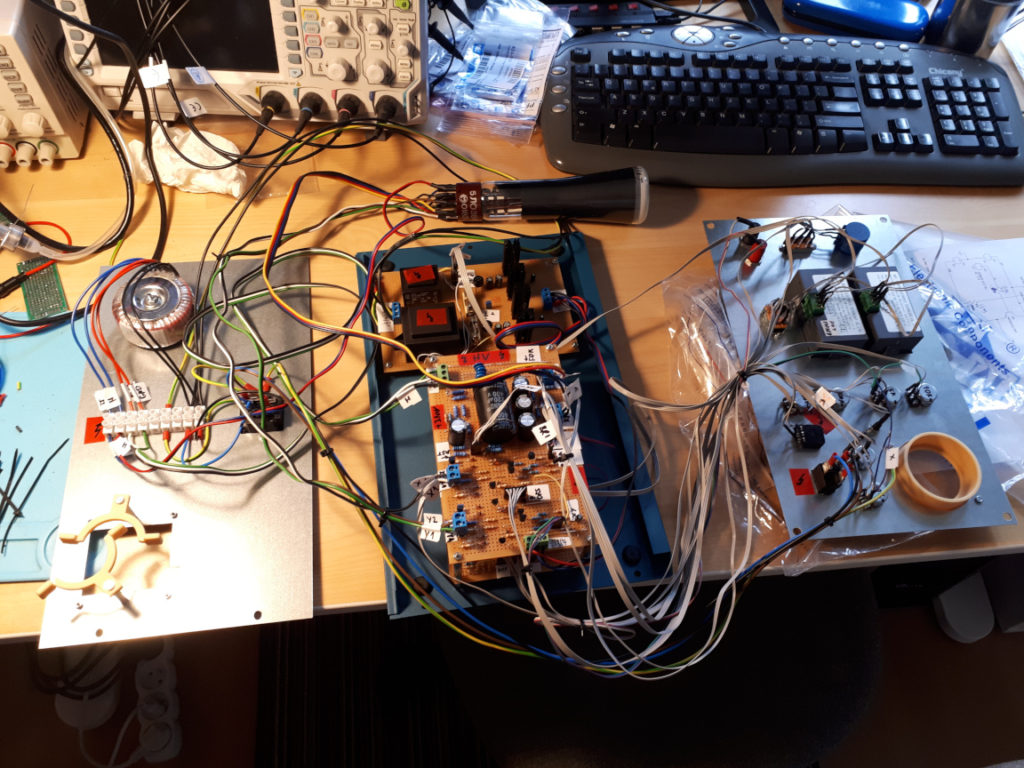
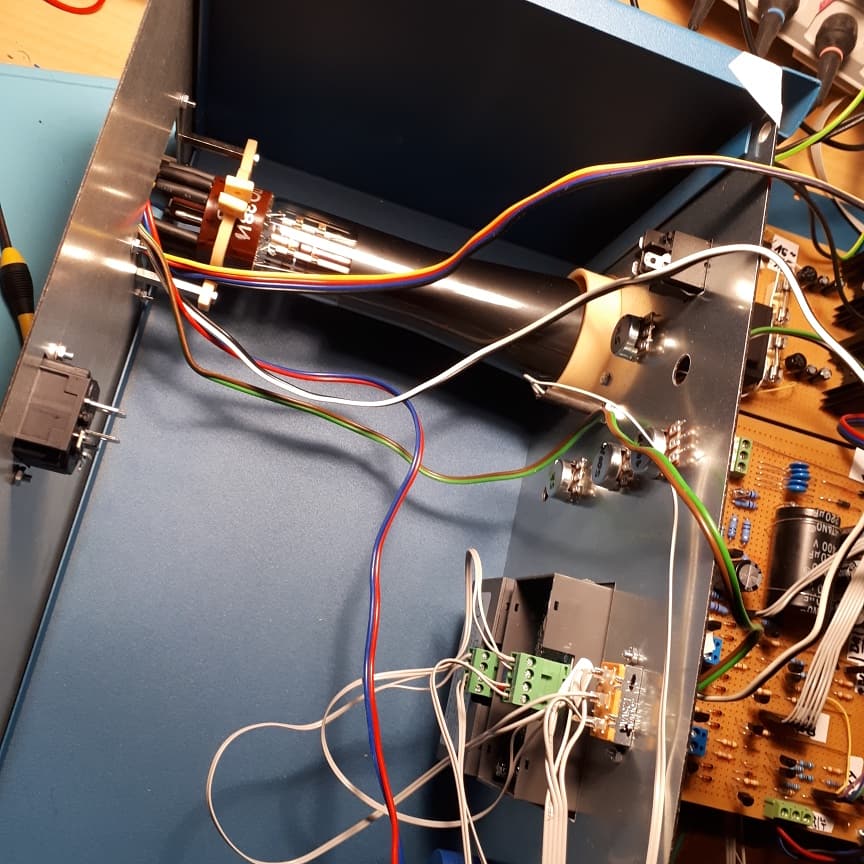
CRT mounting between the front and rear panels
Conclusion
The project of the Curve Tracer grew over several months of hobby-time out of tinkering with opamps and a CRT. It provided a lot of insight about a detailed functioning of a CRT (and the necessary circuits around it, such as the deflection amplifiers), now extinct technology in the professional world. This was the first project where a 3D CAD (Fusion 360) was used for complete mechanical design, and with a very good result. The new 3D-modelling skill is certainly the main “lesson-learned” gained in this project.
Credits:
- curve tracer circuit & the project idea by Mr Carlson’s Lab
- deflection amplifier circuits adapted from Scope Clock SC200 by D. Forbes
- CRT circuit adapted from “Vacuum tube scope” by danyk
Resources
- schematic diagram in PDF, schematic in Kicad
- BOM (incomplete, only major components listed for reference)
- Fusion 360 model, output mechanical CAD files
- Datasheets 5LO38I: 5lo38.pdf, 5LO38I.pdf, 5LO38ID.jpg
x8emsr